|
CIRCUIT
CLOUTS
Home of
the United League · Est. 1951
|
July 16, 1974
|
|
|
|
|
|
|
|
|
STANDINGS (by
division)
|
|
|
|
TOP STORIES |
|
Orlando Cepeda's
3-run homer in the first inning held up,
as the East ended a four-year drought,
winning the 12th UL All-Star Game 3-2 at
Frank Thomas Memorial Stadium.
Cleveland won six in a row and
recaptured first place in the East.
Jim Palmer was 2-0 with a 0.54 ERA in
two starts, and Elliott Maddux hit .350
his first six games after a two-month
stint on the DL.
San Francisco
knocked Chicago out of the top four, but
suffered a huge blow when it lost ace
Bob Moose for the season with a torn
ACL. George Foster drove in 14
runs in 9 games.
Manhattan's Ken
Griffey completed the league's longest
hitting streak in five years, hitting
safely in 24 games.
|
|
ON THE MEND |
|
ATL
|
--- |
|
BOS
|
SP Chris Short (7-8 wk) |
|
BRO
|
3B Dave Chalk (4
mo)
MR Mike Kekich (5-6 wk) |
|
CHI
|
SP Stan Bahnsen (8 mo)
3B Al Gallagher
(7 wk) |
|
CLE
|
SP Rick Reuschel
(2 mo)
3B Dan Driessen
(6 wk)
MR Charlie Hough
(5-6 wk)
|
|
DAL
|
CF Cesar Cedeno
(7-8 wk)
3B Dave Kingman
(4 wk)
SS Dave Concepcion (3 wk) |
|
DEN
|
CF Mickey Rivers
(8-9 wk) |
|
DET
|
MR Tom Walker (11-12 mo)
2B Bobby
Valentine (2 wk) |
|
LA
|
--- |
|
MAN
|
SP Doug Rau (4-5 wk) |
|
MON
|
LF Ben Oglivie (3 wk) |
|
STL
|
--- |
|
SF
|
SP Bob Moose (11
mo)
SP Jerry Koosman (5-6 wk)
RF Richie Zisk
(2-3 wk) |
|
WAS
|
CF Al Oliver (8 wk)
3B Richie Hebner
(4-5 wk) |
|
|
min 2 weeks
new injury |
|
|
| TRADES |
June 1 (313)
DETROIT gets
MR Bob Locker
MONTRÉAL
gets
MR Max Leon
June 16 (314)
CLEVELAND gets
MR Frank Linzy
SP Clyde Wright
MONTRÉAL
gets
3B George Brett
LF Bill Buckner
CLE '75 3rd round pick
|
|
|
ALL-STAR GAME ISSUE
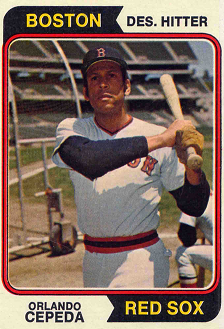 Cepeda
Blast Ends East Drought Cepeda
Blast Ends East Drought
Cy Young Parade Highlights 12th Classic
BROOKLYN (July 4)
- Orlando Cepeda delivered a 437-foot home run into the
cheap seats in Frank Thomas Memorial Stadium in the
first inning tonight, giving the home East Division
All-Stars three runs that would hold up for a 3-2 win.
The win ended a four-game losing streak for the
Orientals, giving them their first All-Star victory of
the 1970s. Chicago Colts Bill Singer, one of the
heroes of the World Series-winning Colts last year,
started shaky and got worse. The 29-year-old Cy
Young winner, who has 18, 19, and 20 wins in the last
three seasons, let nerves get to him, as he allowed a
single, and wild pitch, and a walk before serving up the
three-run dong to Cepeda. Cha Cha became the first
reigning home run champ to homer in an All-Star Game,
and took game MVP honors.
The West, winners of
the last four All-Star Game, got a run back in the top
of the second when Ken Henderson scored on a Dave Parker
sac fly, and halved the lead to 3-2 in the seventh on
Parker's RBI groundout. But after Gary Thommason
walked, Detroit's Ken Holtzman and Boston closer Wayne
Twitchell retired six batters in a row to nail down the
victory.
One of the highlights of the game was
the parade of Cy Young (and Cy-caliber) pitchers who
entered the fray in the fifth and sixth innings.
Johnny Podres, Bob Moose, Don Wilson, and Fritz Peterson
all pitched back to back. The three Cy Young winners
and Wilson, who has led the Monuments to two World
Series crowns, put on a pitching clinic, retiring 11
batters in a row, before Jorge Orta broke it up with a
single off Peterson. Podres struck out two (Bando and
Thomasson), Wilson struck out two (Carew and Henderson),
and Moose battled Cepeda and ended up striking him out.
The All-Star Game will return to Arroyo Seco Stadium
in Pasadena, Calif., home of the Los Angeles Outlaws.
The game will again be on July 4. L.A. hosted the
second All-Star Game in 1964, which was won by the East
8-3 in a game with a record five home runs.
 Assaying
L.A. Assaying
L.A.
by Glen Reed
Everybody gets that building a winning team is hard and
all about making tradeoffs: pitching or hitting? speed
or defense? contact and walks or power? strikeout
pitchers or control pitchers? You only have so many
chips to spend, so you pick your poison and go with it.
Once you decide on what strategy to employ, the type of
team you aim to build, then your success or failure
basically comes down to your execution on that plan and
the vagaries of player development, injuries, and
variability in performance over time. Now the beauty of
having managed teams in both divisions is that I have
kept an eye on many different teams, including L.A., my
rival throughout my time in ATL. For this reason, I have
put more than a little thought into the Outlaw
franchise, and thought it might be interesting to throw
up some ideas around what's the matter with L.A.
First, the caveats. It feels a little weird talking
about what's "wrong" with a team that has posted 10
winning seasons out of the last 12, tallying a World
Series appearance in that time, and is eight games over
.500 at the halfway point. Those are the sorts of
problems fake baseball managers everywhere want to have!
And it's also certainly possible that the only thing
standing between L.A. and more World Series appearances
is geography--for many seasons now the West has been the
best division in the circuit, featuring four different
division winners in that 12 year span, including two
different versions of a Colts dynasty team. And
note that those four don't include San Francisco, which
has been a better-than-average pitching team since about
the late 1960s. That's living in the high-rent district,
jack! And it's hard to always keep up with the Joneses.
But having said all that, there's still room for
discussion. Clearly, GM Peter Vays thinks his team has a
problem. And for two seasons in a row now I have called
L.A. the best team in the West, but of course, L.A.
failed to make the playoffs last year and the Bandits
are underperforming lofty expectations again this
season. Why? Let's start with what's to like about the
Outlaws. They're basically my type of team--the classic
Earl Weaver two-walks-and-a-dong-offense with strong
starting pitching and a talented closer, forget about
the rest of the pen. Of course, good starters allow you
to save money and chips on the middle relievers--you're
not going to use those guys anyway because most nights
your SPs are going to deliver the game direct to your
closer.
But it should be obvious that your
closer better be bad ass under this sort of arrangement.
Turns out Pedro Borbon is, in fact, insanely talented,
but his performance has been diabolical given his
ratings--the dude has eight losses at the halfway point
and has converted just 2/3 of his save opportunities.
This alone goes a long way toward explaining the team's
underperformance (Pythagorean and otherwise) to date.
The rest of the bullpen is actually pretty good,
certainly no worse than average. Paradoxically, though,
this actually hurts your Pythagorean math--most teams
have MRs that will get pounded now and again, inflating
your runs allowed in games you were probably going to
lose anyway (the reason your MR is in there is that your
SP has been knocked out of the game, or was pinch hit
for because you were behind). But having good MRs means
you don't get as many of those sorts of blowouts,
suppressing your runs allowed, which helps your
Pythagorean, though not necessarily your actual, record.
Indeed, when we look at the numbers, we find
that about 40% of LA's games have been one-run affairs,
and they're basically .500 in those games. So what's it
all mean? My prognosis on the pitching/bullpen front
would be for improvement commensurate with talent and
ratings, which would augur well for L.A. over the second
half of the season because Borborn definitely has the
skills to pay the UL bills. Alternatively, if he
continues to blow, then we have to consider the
possibility that he's not as good in reality as his
ratings suggest, or maybe he's just the latest in a long
line of closers to see sustained underperformance before
bouncing back in subsequent seasons to dominate (Don
Gross and Ray Lamb come immediately to mind, because I
endured the same thing with them myself. Even the great
Hoyt Wilhelm had a nightmare season. Seems to happen way
more with closers, likely because of the small number of
innings they throw--no chance to even it out).
But much of the discussion about the team correctly
focuses on the offense, which stands in the bottom half
of the league in every metric except for home runs (5th)
and walks (1st). How can the team of Henderson and
Singleton and Thomasson and Santo and Winfield and
Roberts put up these sorts of stats? Let's go back to
the basics. When putting together your lineup, you want
league-average dudes at their position at worst, and as
many above-average dudes as you can get your hands on.
Now, maybe you disagree, but at least it gives us a
framework to evaluate LA's offense: at catcher, D.W.
Roberts is dead in the middle of the pack in OPS terms
(sweet player no doubt, but catcher is very deep, imo);
at 1b, you got three guys at .725 OPS, then you gotta
drop down another 150 points to find Superjew. Somebody
said Rose had the lowest OPS in the league at .550,
which is horrible, but at second base, it's only like
100 points below average. Superjew has a .575 OPS *at a
pure mashing position* and so is probably at least 225
points below average for his position. I am certain
there is no other player in the league underperforming
as badly. At second base, Schilling is below average in
OPS terms, while Santo and Speier at third and short,
respectively, are right in line for their positions.
Singleton in left field is a sweet player, but because
he plays at such a mashing position, his .800 OPS is
actually slightly below average. Only Thomasson in
center and Henderson in right put up OPS in excess of
averages for their positions. So looked at in this way,
is it that surprising that L.A. is in the bottom half in
most offensive categories? Only two guys are
outperforming their positional competition, and the rest
of the guys are average at best or below (way, way below
in Superjew's case).
The question is, why? It's
hard to know without being able to look inside the black
box and figure out all the variables and levers the game
is pulling, but my guess is that the Earl Weaver-style
offense is less effective in the current game and
pitching-dominated era than in prior years.
'50s/golden-era baseball leagues are all about hitting
dongs and suppressing dongs. But when you get into the
pitching dominated '70s, it's seems to me that more and
more pitchers have high movement. Every year, more of
those dudes come into the league, such that 4/8/8 seems
standard these days. Sure, there are guys in the draft
with 7 movement (or even lower) but those guys generally
don't make it to the bigs, or don't fare as well (of
course there are some exceptions). Instead, in a 4/8/8
world the only real vulnerability is stuff, or hits
allowed. But the Earl Weaver system isn't really well
suited to exploit this weakness. The typical offensive
dude on L.A. (or on my teams) is 6/8/8 or some similar
combination where contact is typically your worst trait.
So totally speculating here, but my best guess as of now
is that L.A.'s mix of attributes isn't exactly right for
the given pitching climate. 6/8/8 matches exactly the
average pitcher's 4/8/8 strengths, and doesn't really
exploit their weaknesses. The Bandits have three guys
with 8 contact rating (Winfield was just called up),
four guys with a 6 contact rating (Ivie was just called
up), and every other position player is at 5 or less. My
sense is that this goes a long way toward explaining why
the team has the worst average in the circuit, which
weighs on every other offensive stat, so that even
though you got a ton of walks and dongs, you still end
up with poor OPS and runs scored.
Long article,
likely raises more questions than it answers, and
potentially says that L.A. offense has a big handicap.
All that said, I *still* like the outlaws to win it
because dominant starters and a super-talented closer is
too strong a combination to overlook on the pitching
side, and because the problems on offense are actually
fairly easy to fix (first base being the easiest
position to repair by far). Or maybe said differently,
the starting pitching is so good, you only need modest
offensive improvement to make big gains in terms of
wins, *assuming* the closer does his job. Good times.
|
|
|
|
|
|
LEAGUE
LEADERS |
|
BATTING AVERAGE
|
HOME RUNS
|
RBI
|
VORP
|
RUNS/GAME
|
|
Dave Parker, ATL
|
.352
|
|
Ken Griffey, MAN
|
.342
|
|
Joe Rudi, BRO
|
.336
|
|
Joe Torre, ATL
|
.335
|
|
Roy Foster, ATL
|
.326
|
|
Sal Bando, ATL
|
.325
|
|
Craig Robinson, BOS
|
.323
|
|
*Boog Powell, STL
|
.323
|
|
Bernie Carbo, WAS
|
.322
|
|
*Tom Grieve, DEN
|
.317
|
|
|
|
|
|
|
|
|
Tom Grieve, DEN
|
30
|
|
Reggie Jackson, DET
|
23
|
|
Sal Bando, ATL
|
21
|
|
Ken Henderson, LA
|
21
|
|
Boog Powell, STL
|
20
|
|
Bobby Grich, DET
|
19
|
|
Mike Schmidt, BRO
|
19
|
|
Bernie Carbo, WAS
|
18
|
|
Roy Foster, ATL
|
18
|
|
Joe Torre, ATL
|
17
|
|
|
|
|
|
|
|
|
Tom Grieve, DEN
|
85
|
|
Sal Bando, ATL
|
77
|
|
Reggie Jackson, DET
|
76
|
|
Steve Garvey, MAN
|
72
|
|
Roy Foster, ATL
|
65
|
|
*Bobby Grich, DET
|
64
|
|
Boog Powell, STL
|
64
|
|
Joe Rudi, BRO
|
63
|
|
*Reggie Smith, STL
|
61
|
|
*Jim Rice, SF
|
59
|
|
|
|
|
|
|
|
|
Bernie Carbo, WAS
|
50.7
|
|
Sal Bando, ATL
|
43.4
|
|
Boog Powell, STL
|
36.8
|
|
Joe Torre, ATL
|
35.9
|
|
Dave Parker, ATL
|
30.6
|
|
Craig Robinson, MAN
|
30.2
|
|
Reggie Jackson, DET
|
29.0
|
|
*Tom Grieve, DEN
|
28.4
|
|
*Bobby Grich, DET
|
26.6
|
|
Roy Foster, ATL
|
26.2
|
|
|
|
|
|
|
|
|
|
ATLANTA
|
5.5
|
|
|
DETROIT
|
4.9
|
|
|
BROOKLYN
|
4.8
|
|

|
DENVER
|
4.8
|
|
|
ST. LOUIS
|
4.6
|
|

|
MANHATTAN
|
4.6
|
|
|
WASHINGTON
|
4.5
|
|
|
BOSTON
|
4.3
|
|
|
CHICAGO
|
4.1
|
|
|
DALLAS
|
4.0
|
|
|
SAN FRANCISCO
|
3.9
|
|
|
LOS ANGELES
|
3.8
|
|
|
MONTRÉAL
|
3.8
|
|
|
CLEVELAND
|
3.8
|
|
|
EARNED RUN AVERAGE
|
WINS
|
STRIKEOUTS
|
VORP
|
RUNS ALLOWED/GAME
|
|
Phil Niekro, LA
|
2.13
|
|
Bob Moose, SF
|
2.15
|
|
Don Wilson, WAS
|
2.26
|
|
Bill Singer, CHI
|
2.33
|
|
Jon Matlack, STL
|
2.51
|
|
Johnny Podres, WAS
|
2.56
|
|
Fritz Peterson, LA
|
2.57
|
|
Larry Dierker, LA
|
2.69
|
|
*J.R. Richard, CLE
|
2.76
|
|
*Dave Roberts, LA
|
2.81
|
|
|
|
|
|
|
|
|
Bob Moose, SF
|
12
|
|
Don Wilson, WAS
|
11
|
|
Bill Singer, CHI
|
10
|
|
10 tied with
|
9
|
|
|
|
|
|
|
|
|
|
|
|
|
|
|
|
|
|
|
|
|
|
|
|
|
|
|
Don Wilson, WAS
|
177
|
|
J.R. Richard, CLE
|
160
|
|
Bert Blyleven, BOS
|
142
|
|
Bill Singer, CHI
|
139
|
|
*Bob Moose, SF
|
125
|
|
Ken Brett, MAN
|
123
|
|
Fergie Jenkins, SF
|
123
|
|
Jon Matlack, STL
|
122
|
|
Larry Dierker, LA
|
119
|
|
Tom Griffin, DAL
|
117
|
|
*Wayne Simpson, DAL
|
117
|
|
|
|
|
|
Bob Moose, SF
|
46.4
|
|
Phil Niekro, LA
|
39.3
|
|
Bill Singer, CHI
|
36.5
|
|
Fritz Peterson, LA
|
35.8
|
|
Don Wilson, WAS
|
34.2
|
|
*Ken Brett, MAN
|
30.8
|
|
Jon Matlack, STL
|
30.2
|
|
Larry Dierker, LA
|
29.8
|
|
*J.R. Richard, CLE
|
29.7
|
|
*Fergie Jenkins, SF
|
28.5
|
|
|
|
|
|
|
|
|
|
LOS ANGELES
|
3.2
|
|
|
SAN FRANCISCO
|
3.4
|
|
|
CLEVELAND
|
3.5
|
|
|
CHICAGO
|
3.7
|
|
|
MANHATTAN
|
3.9
|
|
|
WASHINGTON
|
4.3
|
|
|
BOSTON
|
4.3
|
|
|
ATLANTA
|
4.4
|
|
|
DALLAS
|
4.7
|
|
|
MONTRÉAL
|
4.7
|
|
|
DETROIT
|
4.8
|
|
|
ST. LOUIS
|
4.9
|
|
|
BROOKLYN
|
5.0
|
|
|
DENVER
|
6.2
|
|
double arrows
indicate
moves of 3+ places
|
|
|
|
AWARDS & MILESTONES |
|
BATTER of the MONTH
|
PITCHER of the MONTH
|
ROOKIE of the MONTH
|
MILESTONES
|
|
APR
|
Reggie Jackson, DET |
|
MAY
|
Joe Torre, ATL |
|
JUN
|
Tom Grieve, DEN |
|
JUL
|
|
|
AUG
|
|
|
SEP
|
|
|
|
APR
|
Fritz Peterson, LA |
|
MAY
|
Don Wilson, WAS |
|
JUN
|
Bob Moose, SF |
|
JUL
|
|
|
AUG
|
|
|
SEP
|
|
|
|
APR
|
Dave Parker, ATL |
|
MAY
|
John Stearns, BRO |
|
JUN
|
Jim Rice, SF |
|
JUL
|
|
|
AUG
|
|
|
SEP
|
|
|
Orlando Cepeda, BOS
3 home runs in a game
(June 25)
Ken Griffey, MAN
24-game hitting streak
(ended July 12)
|
|
PLAYER of the WEEK
|
|
4/8
|
Tim Foli, DEN |
|
4/15
|
Bill Freehan, ATL |
|
4/22
|
Reggie Jackson, DET |
|
4/29
|
Bobby Grich, DET |
|
5/6
|
Joe Torre, ATL |
|
5/13
|
Bill Melton, MAN |
|
5/20
|
Joe Rudi, BRO |
|
5/27
|
Bill Madlock, DEN |
|
|
|
|
|
6/3
|
Tom Grieve, DEN
|
|
6/10
|
Boog Powell, STL
|
|
6/17
|
Steve Garvey, MAN
|
|
6/24
|
Tom Grieve, DEN (2)
|
|
7/1
|
Roy Foster, ATL
|
|
7/8
|
Ross Grimsley, DET
|
|
7/15
|
Tom Grieve, DEN (3)
|
|
7/22
|
|
|
7/29
|
|
|
|
8/5
|
|
|
8/12
|
|
|
8/19
|
|
|
8/26
|
|
|
9/2
|
|
|
9/9
|
|
|
9/16
|
|
|
9/23
|
|
|
|
|
|
|
|
|